CIP Data
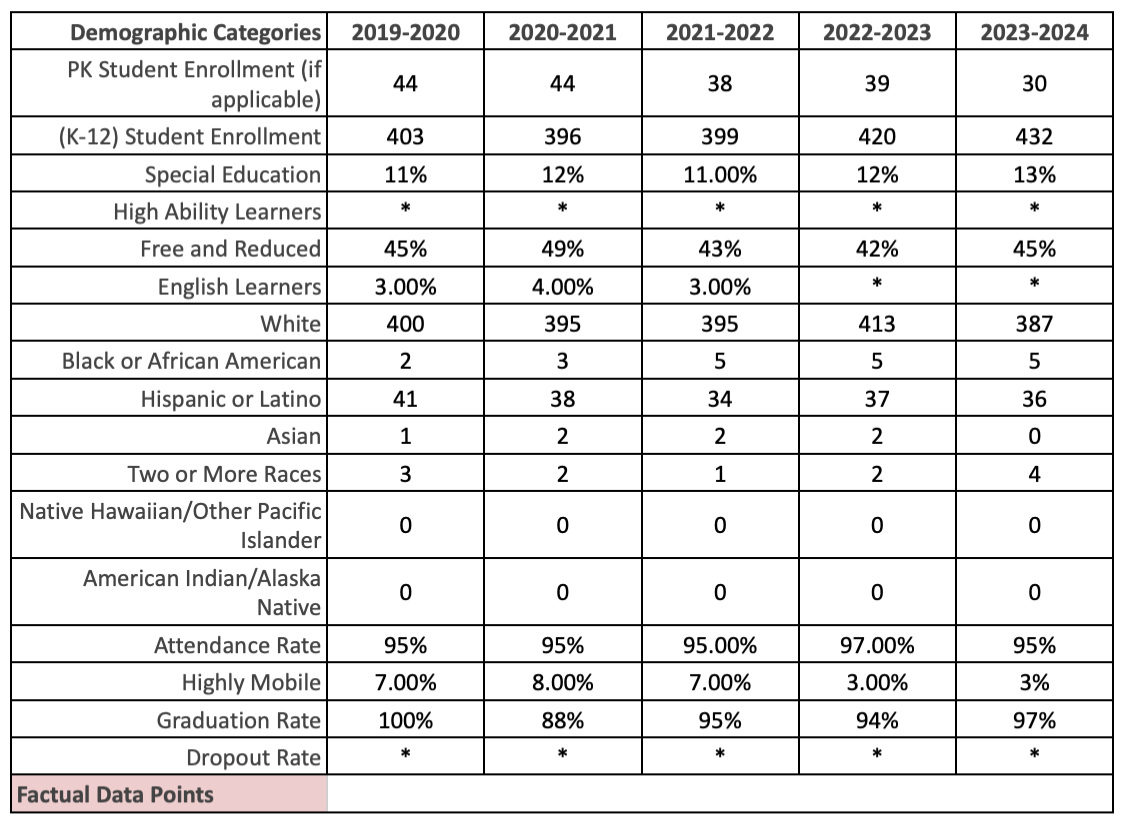
Demographic Categories
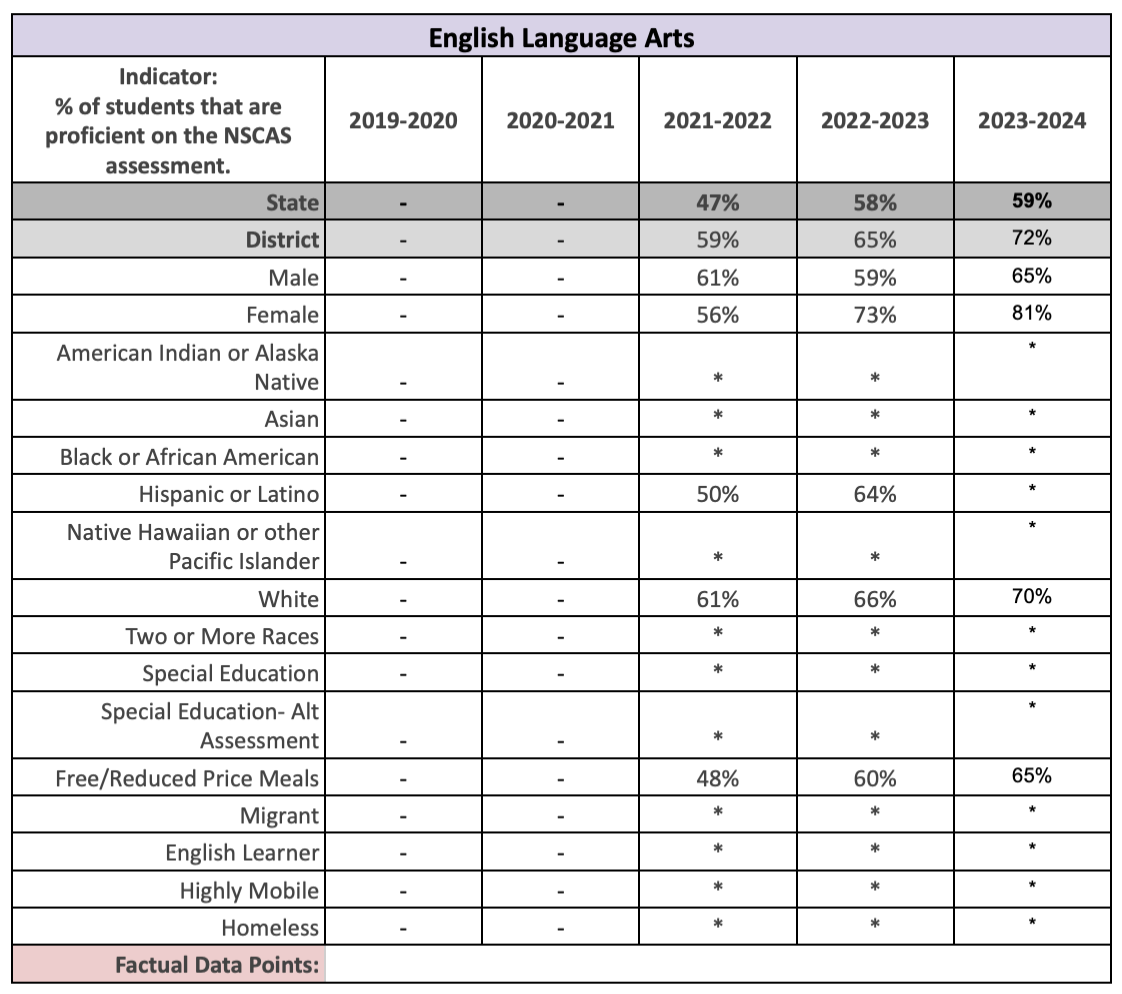
Student Outcome NEP : ELA
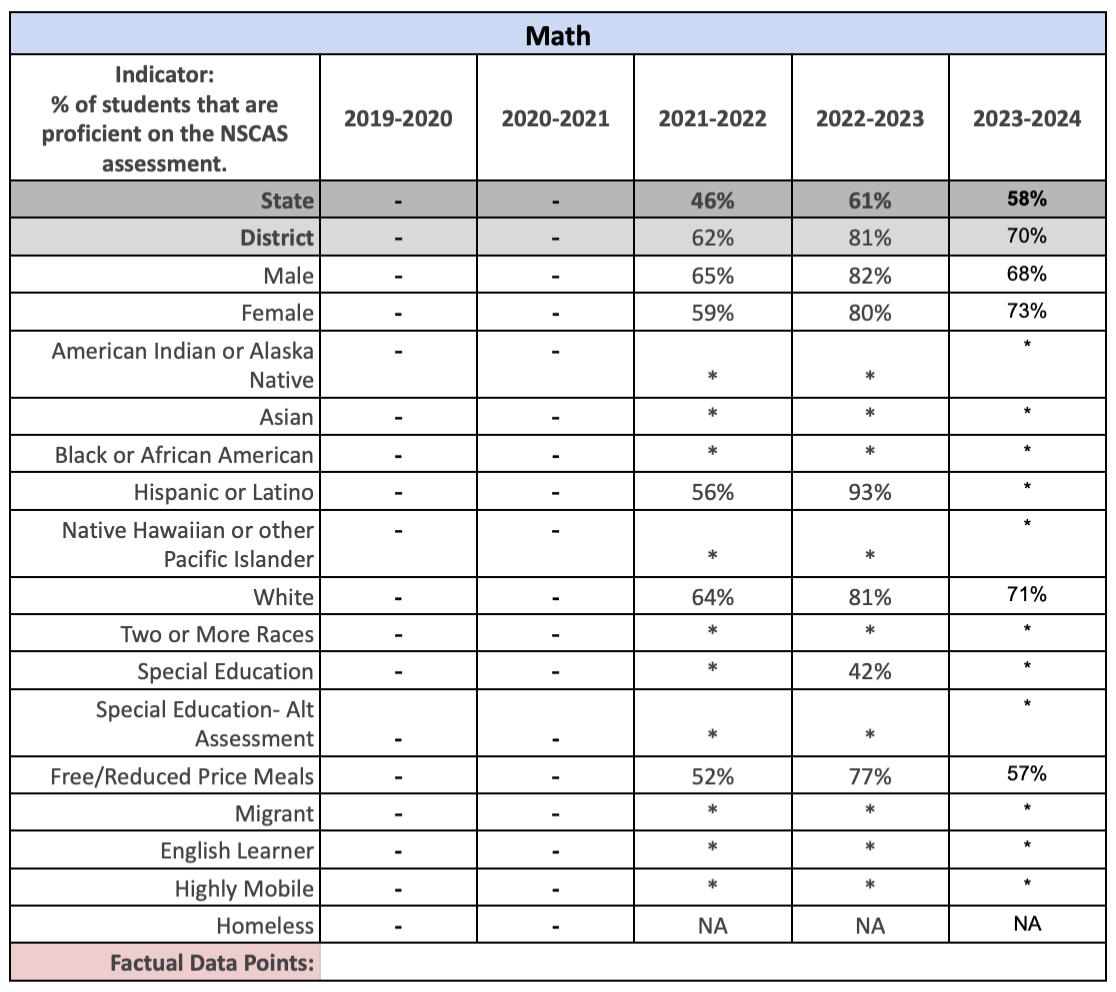
Student Outcome NEP : Math
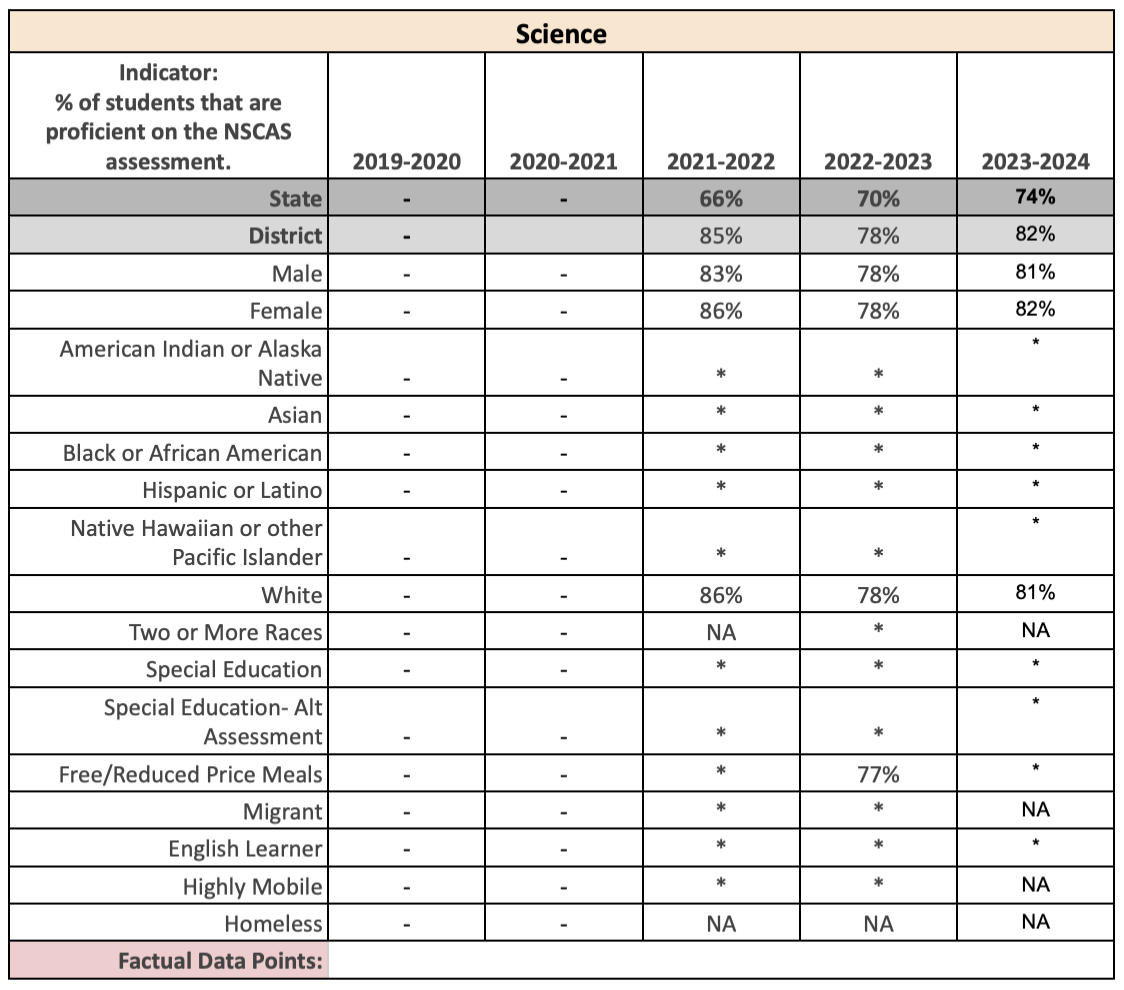
Student Outcome NEP : Science
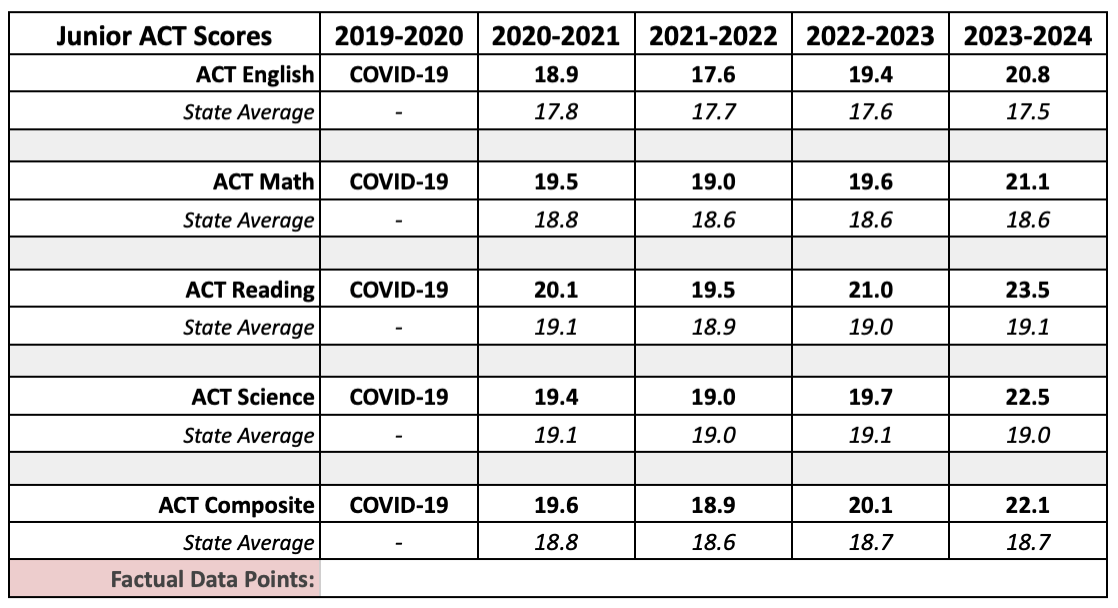
Junior ACT
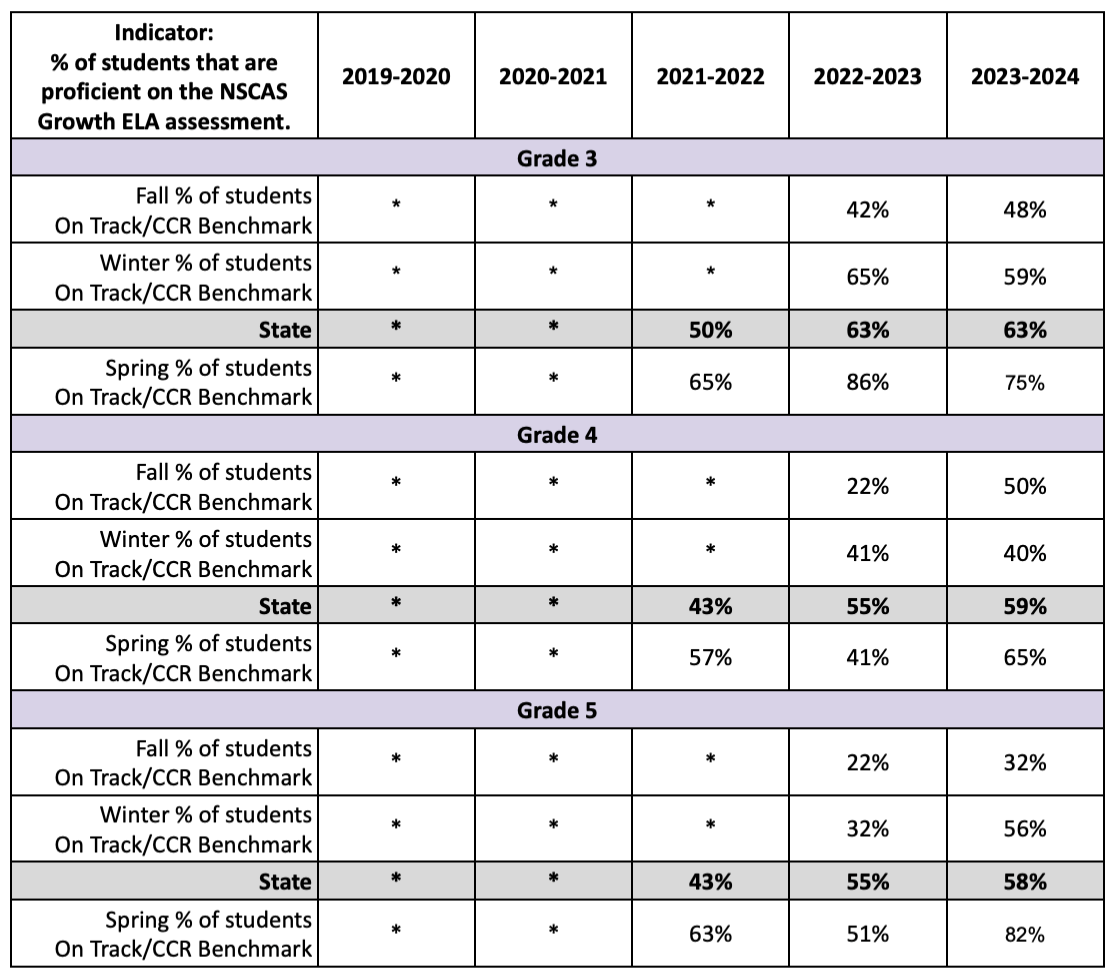
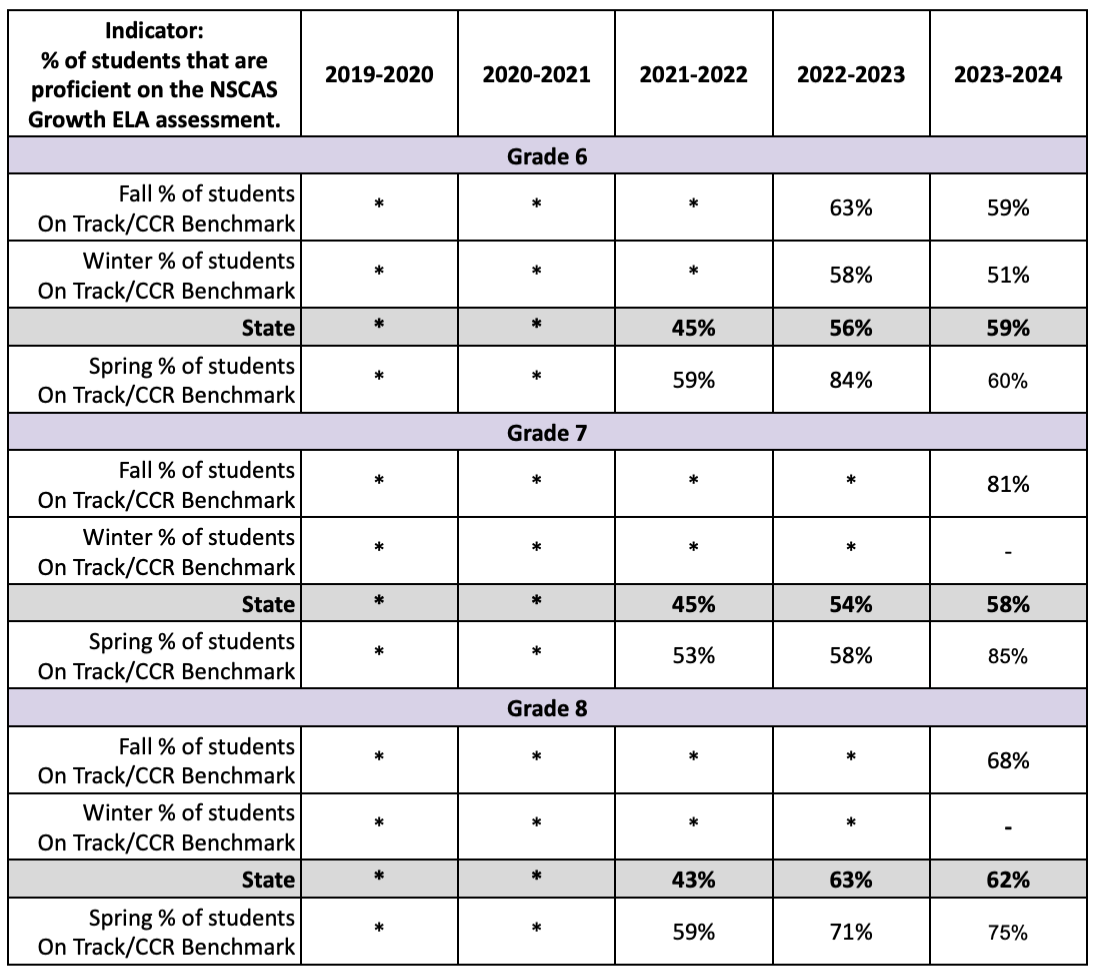
NSCAS Growth : ELA
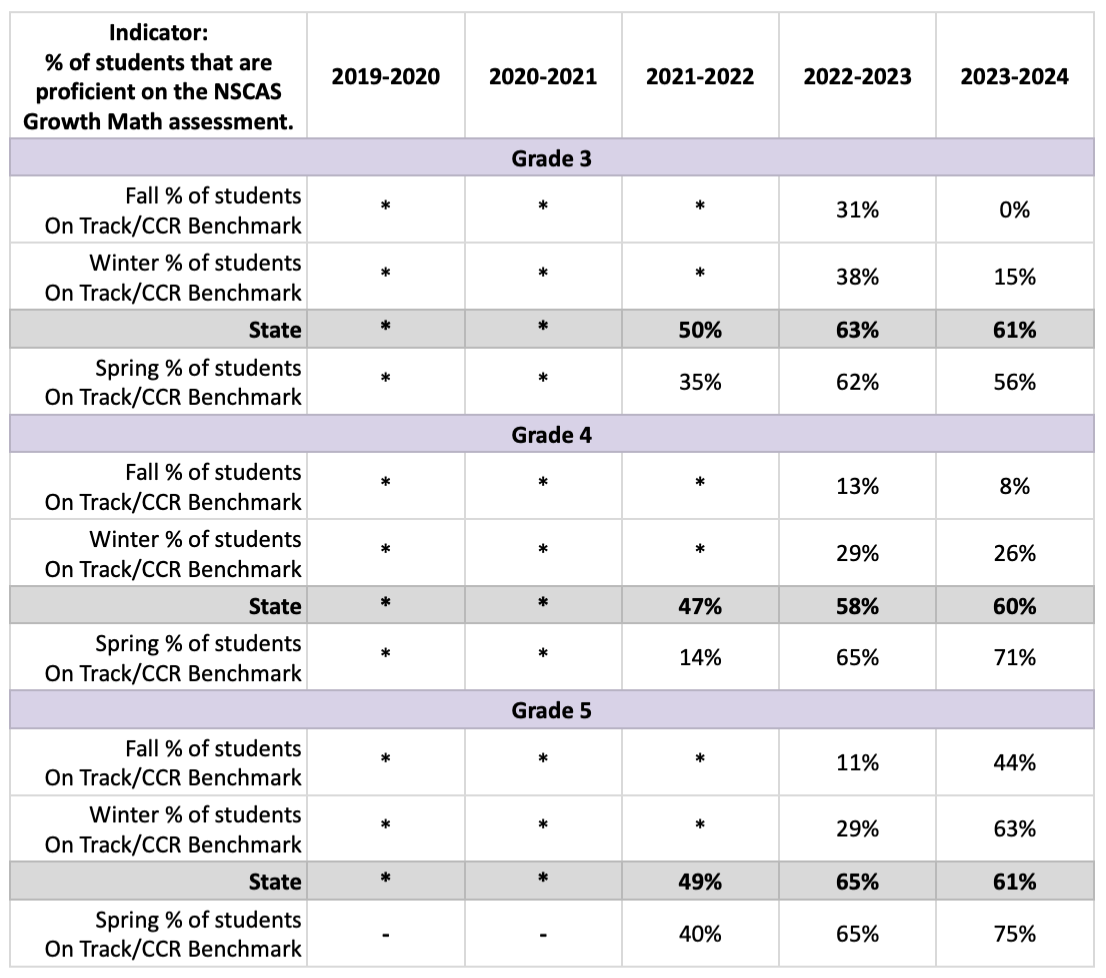
NSCAS Growth : Math
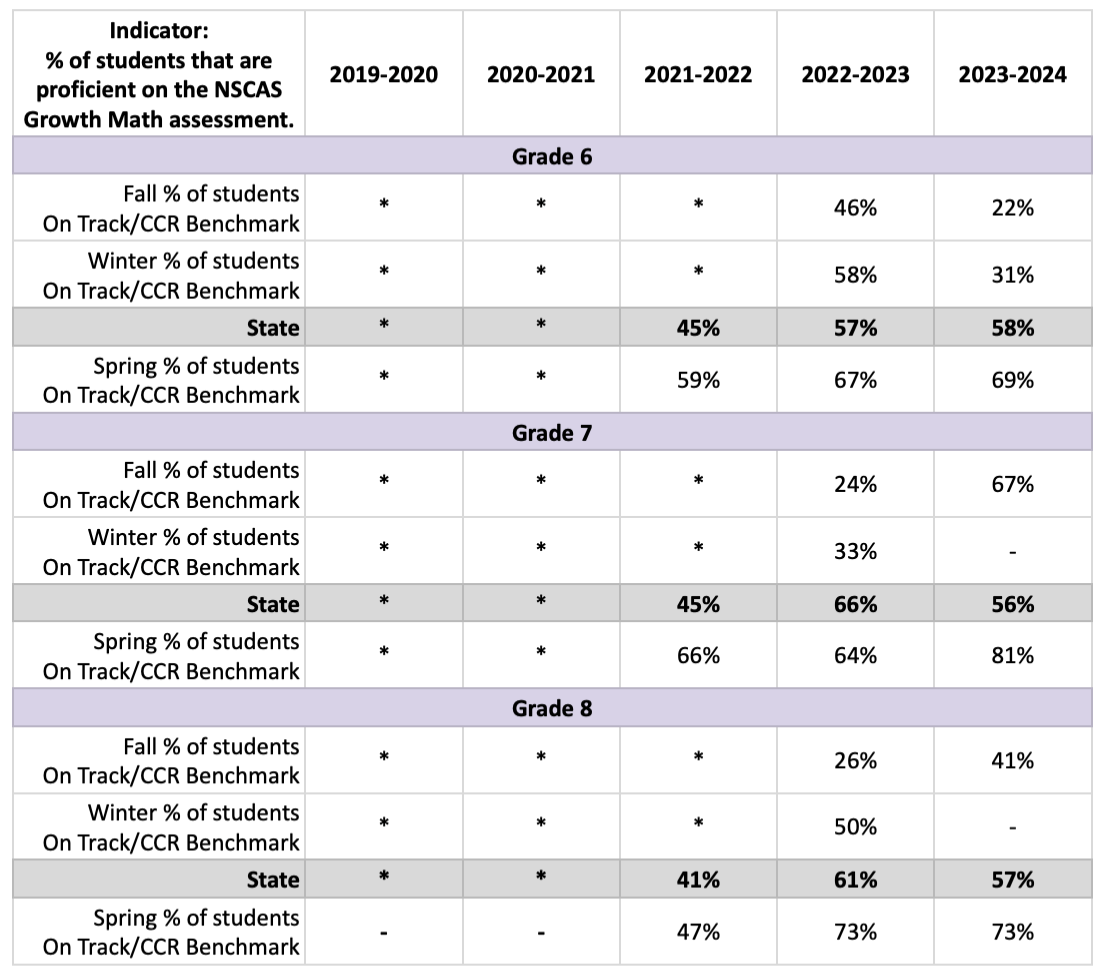
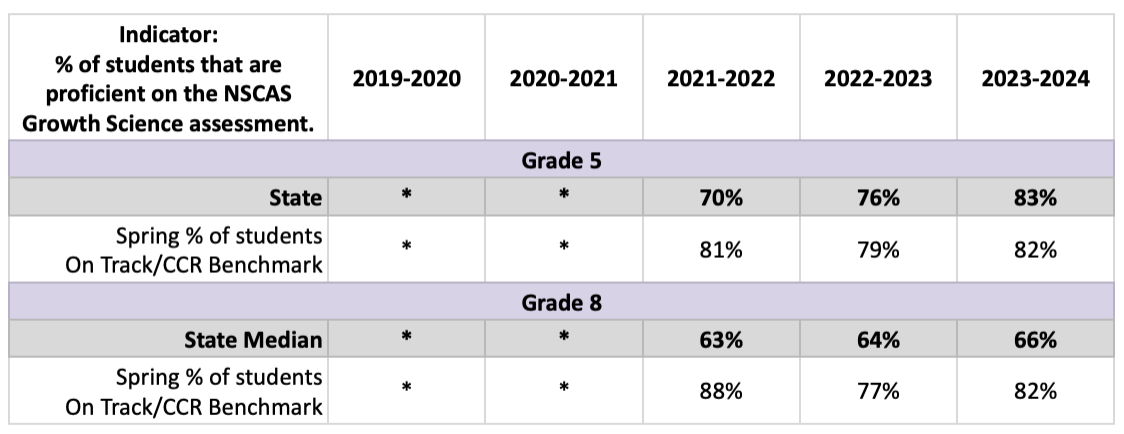
NSCAS Growth : Science
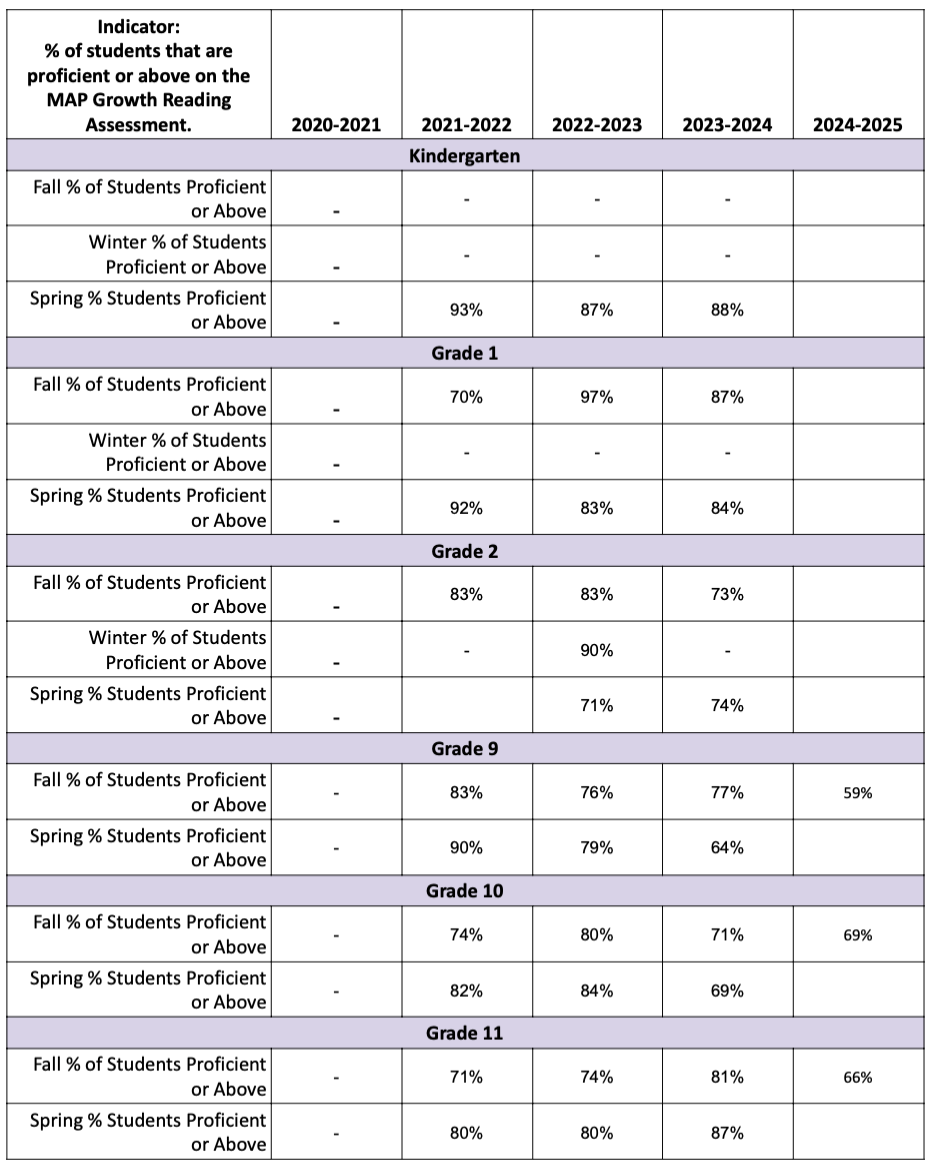
MAPS Reading
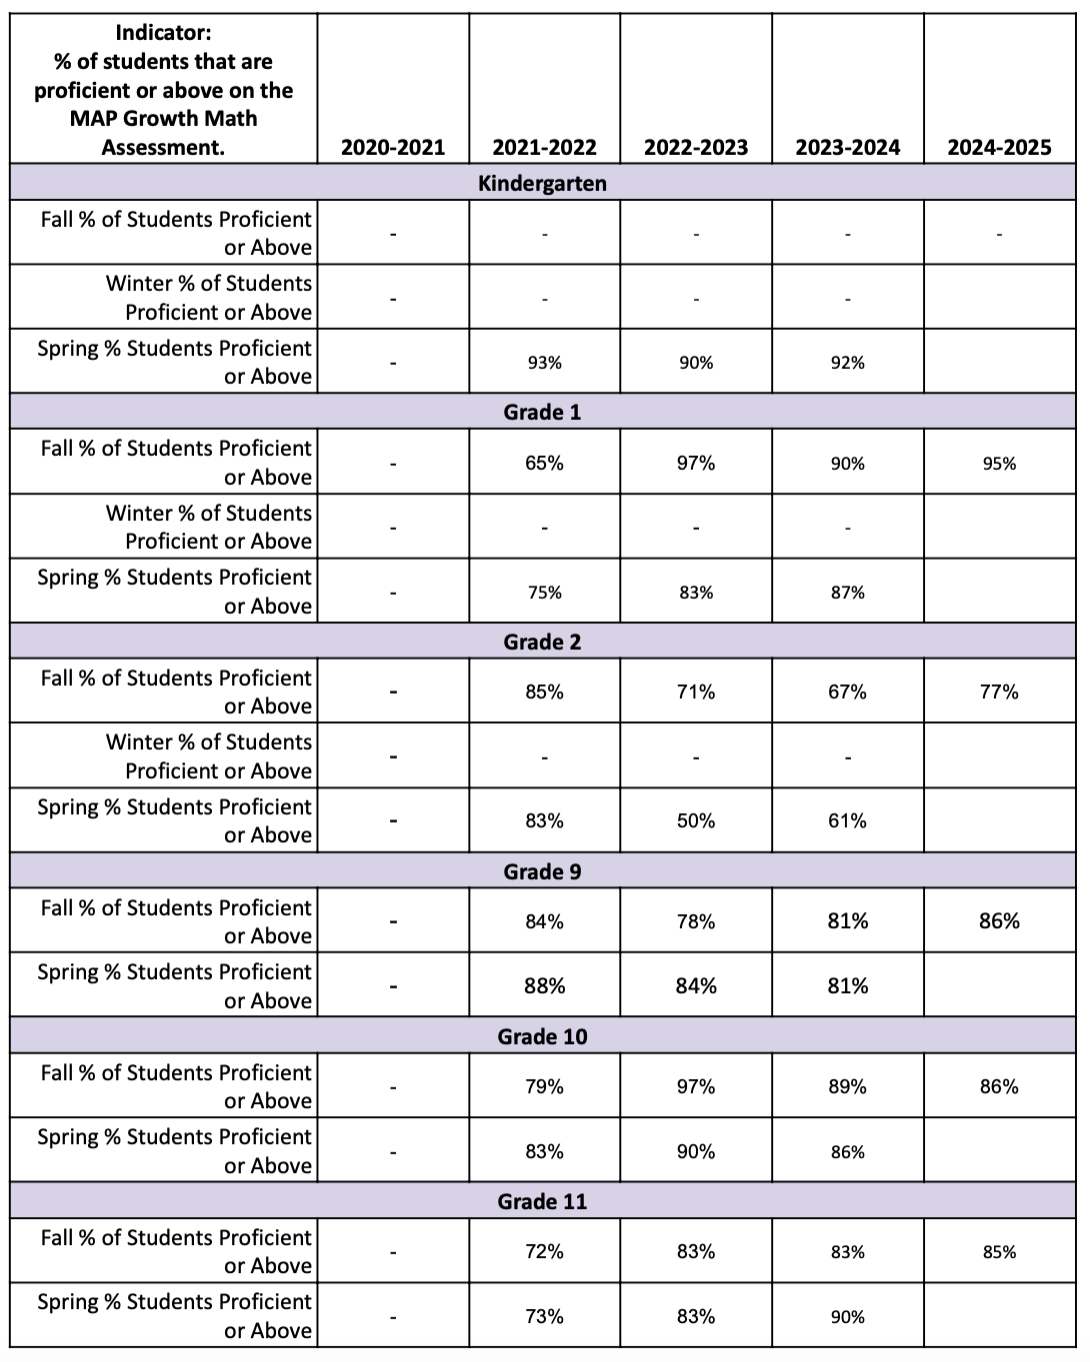
MAPS Math
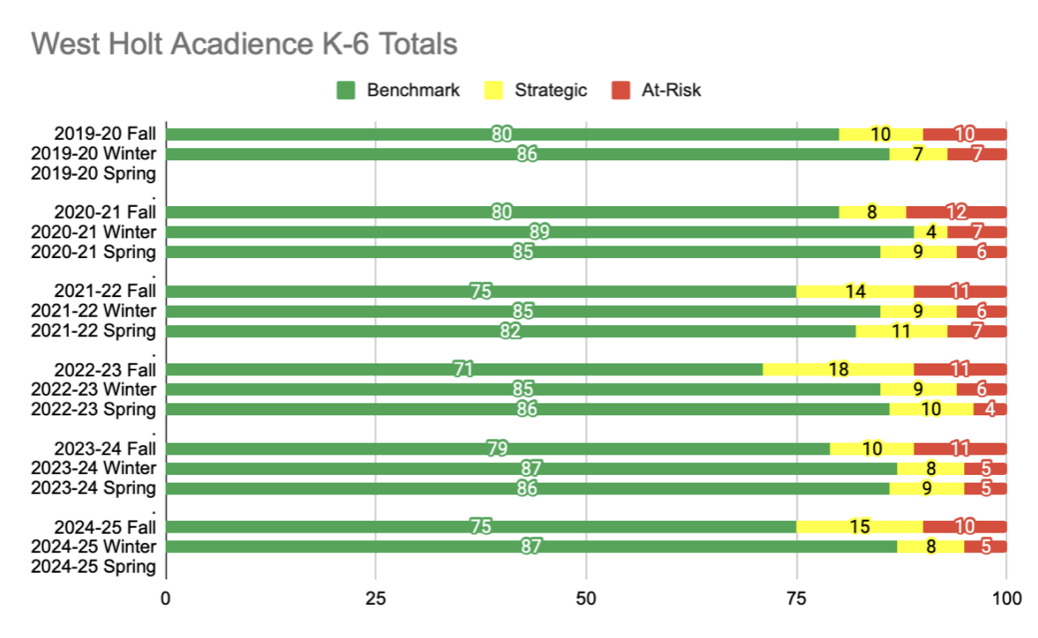
Acadience
AQuESTT Ratings
2019-2020 | 2020-2021 | 2021-2022 | 2022-2023 | 2023-2024 | |
District | Excellent | Excellent | Great | Great | Great |
Elementary | Excellent | Excellent | Excellent | Great | Great |
Middle School | Excellent | Excellent | Great | Excellent | Excellent |
High School | Great | Great | Good | Excellent | Excellent |
Special Education Determination: ILCD
June 2023 | June 2024 | |
Significant Discrepancy | No Risk | No Risk |
Disproportionate- Race/Ethnicity (Indicator 9) | No Risk | No Risk |
Disproportionate- Disability Category (Indicator 10) | No Risk | No Risk |
Child Find (Indicator 11) | No Risk | High Risk |
Part C to Part B Transition (Indicator 12) | No Risk | No Risk |
Secondary Transition | Does Not Apply | Low Risk |
Correction of Noncompliance | Does Not Apply | Does Not Apply |
Timely, Accurate, & Complete Data Submission | No Risk | No Risk |
Subrecipient Audit | Does Not Apply | No Risk |
Graduation (Indicator 1) | No Risk | No Risk |
Drop Out | No Risk | No Risk |
Reading Assessment | High Risk | High Risk |
Math Assessment | Medium Risk | High Risk |
School-Aged LRE | High Risk | High Risk |
Preschool LRE | Medium Risk | No Risk |
Preschool Outcomes | No Risk | High Risk |
State Complaint Filings & Findings | No Risk | No Risk |
Maintenance of Effort | No Risk | Low Risk |
Targeted Improvement Plan | Medium Risk | Low Risk |
Chronic Absenteeism | Medium Risk | Does Not Apply |
Determination | Meets Requirements | Needs Assistance |
